
Orange County Housing Report:
The Buyer’s Roadmap
August 18, 2025
As negotiations lean more toward buyers, data and statistics will help set realistic expectations and guide them to a successful outcome in today’s market.
Knowing the Numbers
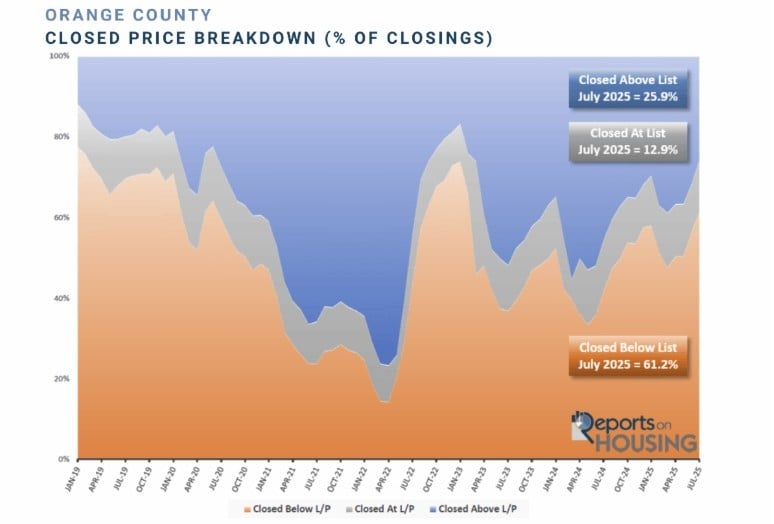
In July, 61% of all Orange County closed sales sold below their original list price, the highest level since February 2023.
Back in the 1990s, before navigation apps existed, driving around an unfamiliar area without a map often left many feeling completely turned around and lost. It was necessary to find a local gas station and purchase a map. Once that special guide was carefully unfolded, it was much easier to ascertain precisely where they needed to go to arrive at their desired location successfully.
Many buyers approach the market today without a proper roadmap. They rely on how they think today’s market should unfold without really knowing the facts. To help navigate the Orange County housing market effectively, they should carefully consider the best, most revealing roadmap: current data and statistics.
In July, 61.2% of all Orange County closed sales sold for below their original asking price. That is the highest level since February 2023, at 65.9%, when home affordability initially crumbled. Mortgage rates skyrocketed in 2022, from 3.25% in January to 7.37% in October of that year. Home buyer demand collapsed due to unaffordability, and the inventory rapidly rose; as a result, more homes sold below their original asking price. In April 2022, only 14% of all homes sold for less than their original asking price. That is when the limited number of homes on the market was flying off the market. It eclipsed 60% of closed sales in September 2022 as rates soared. The height was achieved in January 2023 at 73.8%. In July 2019, before the pandemic, when the housing market followed normal, cyclical trends, 69.8% of all sales closed below their original asking price, slightly higher than today.
Excerpt taken from Stephen Thomas
Check out this article next