
A Climbing Supply of Homes
The active inventory is 56% higher than last year and is at its highest mid-February level since 2020
The cookies have arrived! It is Girl Scout season once again. There are times when there is an overabundance of young Girl Scouts attempting to sell as many boxes as humanly possible. Some go door to door, others pivot to the local grocery store, while many turn to their parents’ workplaces to increase their sales count. When too many hit the same neighborhood, the competition amplifies; for some, it is very hard to sell their cookies.
That is precisely what is happening in the Orange County real estate market. Many more sellers are hitting the market, the competition is amplifying, and it is very hard for some to sell their homes. There are currently 3,033 homes on the market, 56% more than last year’s 1,939 at this time. That is 1,094 additional homes year-over-year. It is the most homes for mid-February since 2020 when there were 4,030.
The inventory has been rising due to the higher mortgage rate environment. The Federal Reserve raised the short-term Federal funds rate 11 times from March 2022 through July 2023, and long-term mortgage rates exploded higher from 3.25% in January 2022 to over 7% eight months later in September. They have remained above 6% ever since and have been stuck, for the most part, above 7% since July 2023. Higher mortgage rates have precluded many homeowners from placing their homes on the market and selling. They “hunkered down” in their homes and opted not to sell.
The hunkering-down trend occurred because homeowners were unwilling to move due to their low-fixed rate monthly payments. According to the Federal Housing Finance Agency’s National Mortgage Database, 82% of all Californians with a mortgage have a mortgage rate at or below 5% (2024 Q-3), 65% have a rate at or below 4%, and 29% have a rate at or below 3%. Many homeowners have been reluctant to sell their homes and exchange their low rates for today’s substantially higher mortgage rates. In 2023, there were 41% fewer FOR-SALE signs compared to the 3-year average before COVID (2017 to 2019), or over 16,000 missing signs. In 2024, there were 31% fewer sellers, 12,326 less. Yet, that was 3,697 extra signs compared to 2023. In January 2025, there were 2,527 new sellers, only 17% fewer than the 3-year average before COVID, 528 less. It was a 473 home improvement over January 2024, and 817 additional signs compared to 2023.
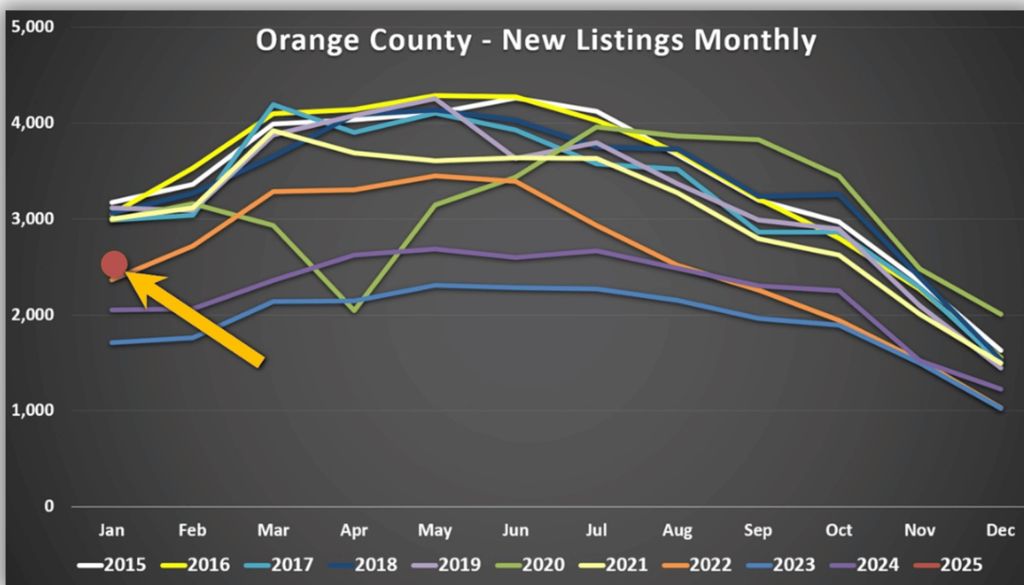
Excerpt taken from Stephen Thomas