Busting Myths
POTENTIAL BUYERS HAVE BEEN LISTENING TO PLENTY OF NEGATIVE SOCIAL MEDIA CHANNELS THAT HAVE BEEN STEERING UNSUSPECTING CONSUMERS IN THE WRONG DIRECTION
Negativity sells. The overabundant doom and gloom real estate headlines obtain a lot of attention. There is a plethora of YouTube, TikTok, Instagram, and X (formerly Twitter) channels devoted to pushing negative narratives about the real estate market. From bubbles to crashes to foreclosure waves to the coming collapse in home prices, the same storylines are pushed on a weekly, monthly, and yearly basis. These channels rack up hundreds of thousands of views, steering countless consumers in the wrong direction for years now. These prognosticators lack any economic credentials, and they have been preying on everyone who has been unable to or missed their opportunity to purchase over the years. Many would-be first-time home buyers have been rooting for a collapse in housing so that they, too, can finally obtain their piece of the American Dream. It is hard to sit on the sidelines and watch housing prices skyrocket at an alarming pace from 2020 through the first half of 2022 in the midst of a once-a-century pandemic that temporarily shut down the economy. Home values reversed course for the second half of 2022 as mortgage rates ballooned higher, yet prices have been on the rise ever since. The dream of owning for many has been out of reach. As a result, the negative narratives blossomed. It is challenging to sift through all the headlines to determine what is true and what is fiction. Yet, the answer is straightforward in examining all the facts. It is time to bust through the myths that have developed about housing.
MYTH—Housing is in a bubble and about to crash. This could not be further from the truth. When home values plunge, as they did during the Great Recession, it is important to consider supply, demand, and the overall health of the housing stock. The U.S. total housing inventory averaged 2.2 million homes from 1996 through 2005. In 2006, prior to the Great Financial Crisis, it eclipsed 4 million homes and remained elevated for five years. The glut of available homes was matched with very weak demand, exasperated by job loss and an unemployment rate that surpassed 10% in 2009. There was a flood of forced sellers who were in a financial jam, unable to pay their monthly mortgage with no equity in their homes. Today, the U.S. total housing inventory is at 1.21 million homes, less than a third of where it was from 2006 through 2008. And today’s housing stock, all U.S. homeowners combined, has been built on strong credit, great jobs, low fixed payments (an excellent hedge against inflation and rising rents), record tappable equity (take out a second loan or cash-out refinance and still have 20% equity), record equity rich (over 50% equity in a home), and record owners who own their homes free and clear. Leading up to the Great Recession, the housing stock was made up of homeowners who purchased with very little or no down payments, low credit scores, subprime loans, pick-a-payment plans, teaser rate adjustable mortgages, fraudulent lending, and a flood of cash-out-refinances. Today’s chronically low inventory is matched up against weak demand, a much better balance than the bubble years of the Great Financial Crisis.
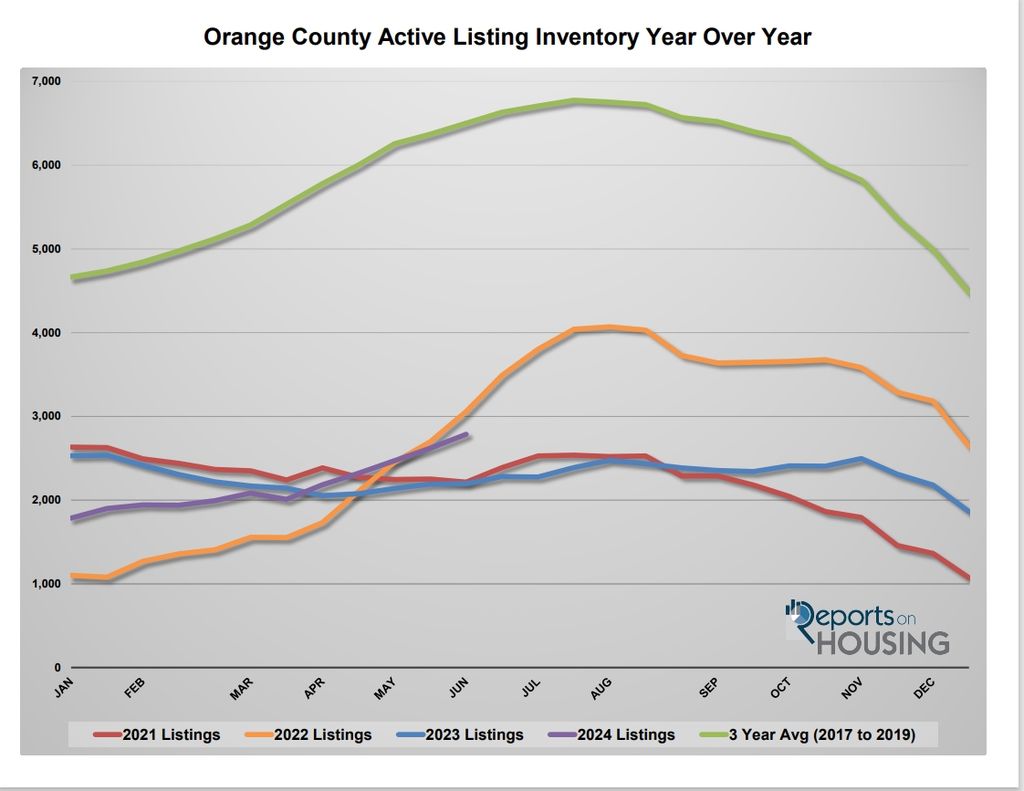
MYTH—Housing inventory is just as bad as last year. Economists and housing analysts consistently point out the lack of available homes to purchase, a depleted inventory with no hope of turning around. While it is true that there is a definitive scarcity of supply, a trend has emerged that sets the housing market apart from last year: the inventory is rising. The active listing inventory in Orange County has grown from 1,785 homes at the beginning of the year to 2,620 homes today, a rise of 47% or 835 homes. It is at its highest level since December 2020. Last year, it was at 2,190, which is 430 fewer homes or 16% less. It is still far from the inventory levels before the pandemic. The 3-year average before COVID (2017 to 2019) there were 6,370 homes at the end of May. That is 143% higher or 3,750 extra FOR-SALE signs. The U.S. inventory is at 1.21 million homes compared to 1.04 million last year, 170,000 fewer or 14% less. It is the highest level since October 2020. Yet, the 3-year
average before COVID was at 1.85 million, 52% higher or an extra 640,000 homes. Nonetheless, the housing inventory is moving in the right direction. There are finally more homes for buyers to choose from, a step in the right direction for a housing market desperate to receive a fresh supply.

Excerpt taken from Stephen Thomas


