A 2023 Forecast
After starting the year with a record low number of available homes to purchase, the inventory soared higher but is still far below pre-pandemic levels.
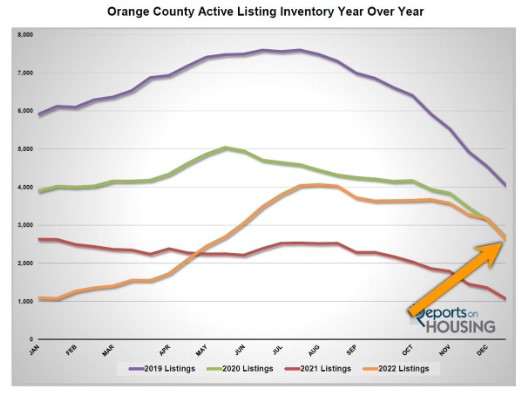
The year started off with an active inventory of 954 homes, the lowest level to start a year since tracking began in 2004. The average start prior to the pandemic was 4,500 homes, so there was nearly nothing available in January. Yet, with a rapidly rising mortgage rate environment, demand slowed substantially as the year progressed. After starting 2022 at 3.25%, rates eventually surpassed 5% in May and eclipsed 6% in June. As a result, the inventory rapidly grew from mid-April until it peaked at the beginning of August at 4,069 homes, a rise of 327% from January 1st. The 3-year average peak prior to COVID (2017 to 2019) was 6,959 homes, 71% higher than this year. From August through year’s end, the number of available homes decreased to 2,642, very similar to 2020 levels and 41% below the 3-year average end to December of 4,479.
The inventory would have dropped even more during the Autumn market, but rates eclipsed 7% in October and took an even larger bite out of demand. Many sellers stagnated on the market without success. That changed during the holidays as rates dropped into the lower 6’s, and the inventory dropped by 939 homes in the last 6 weeks of the year, down 26%. The inventory is poised to drop below 2,500 upon ringing in a New Year, still not enough available homes to purchase.
COVID suppressed the inventory in Orange County in 2020 and 2021. There were 5% fewer homes placed on the market in 2020, or 1,795 missing sellers, and 6% fewer in 2021, or 2,311 missing sellers. With COVID taking a back seat to life in 2022, this was to be the year where more homeowners were poised to enter the fray. That did not occur as many homeowners “hunkered down” and opted to not move. Homeowners may not have been in love with their homes, but they certainly were in love with their loans. An astonishing 89% of California homeowners who have a loan are enjoying a fixed rate at or below 5%. 71% are at or below 4%. And a very fortunate 29% have a rate at or below 3%. From January through November, there were 21% fewer homes placed on the market compared to the 3-year average prior to COVID (2017 to 2019), 7,999 fewer. This trend has grown significantly as the year progressed. In November there were 32% fewer FOR-SALE signs.
The inventory crisis continues, not because of excess demand, but due to homeowners opting to “Hunker Down.”

Excerpt taken from an article by Steven Thomas.


