
Orange County Housing Report:
Pricing for Success
It All Boils Down to Price
The data illustrates a clear trend: the greater the price reduction, the lower the seller’s net proceeds and the longer the home remains on the market.
Active Listings
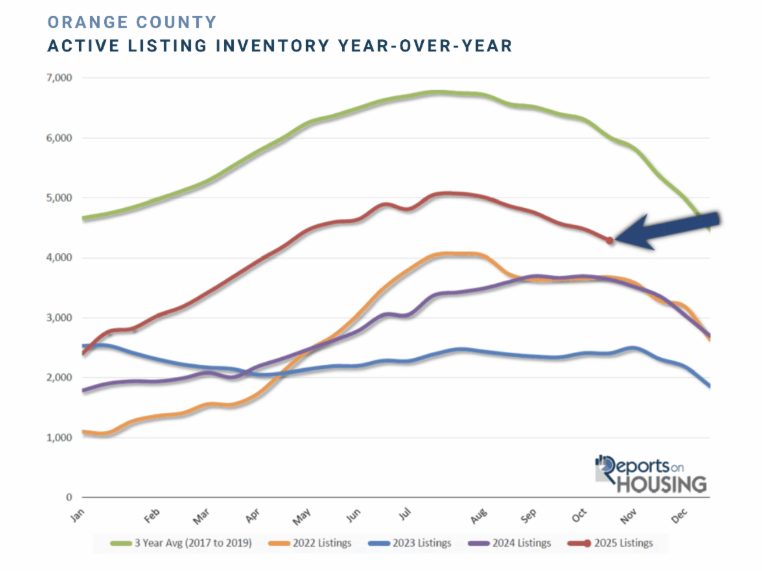
The inventory dropped by 2% in the past couple of weeks.
The active listing inventory decreased by 98 homes over the past two weeks, representing a 2% decrease, and now stands at 4,478, its lowest level since the start of May. It is October, the middle of the Fall Market, when inventory and demand typically drop at similar rates. The inventory has continuously dropped ever since it peaked at the end of July, shedding 12% or 593 homes. It will continue to fall for the remainder of the year and will even pick up steam in mid-November, as housing transitions to the Holiday Market. The fewest homes come on the market in December, and the second fewest in November. Additionally, many unsuccessful sellers give up and remove their homes from the market. As a result, the inventory declines rapidly to close out the year.
Last year, the inventory was at 3,694 homes, 18% lower, or 784 fewer. The 3-year average before COVID (2017-2019) was 6,306, an additional 1,828 homes, or 41% more.
Homeowners continue to “hunker down” in their homes, unwilling to move due to their current underlying, locked-in, low fixed-rate mortgage. This trend has been easing from the lows established in 2023. Through September, 24,066 homes were placed on the market in Orange County, 8,347 fewer than the 3-year average before COVID (2017-2019), 26% less. In 2024, 21,845 homes entered the market, compared to 18,773 in 2023. More sellers are opting to sell in 2025. Yet, for the second month in a row, the number of homes coming on the market was fewer compared to the prior year. In September, 2,211 homes came on the market, 4% less than last year’s 2,303.
Excerpt taken from Stephen Thomas
Check out this article next